B2B Lead Generation Pricing Models That Actually Work
Compare B2B lead generation pricing models, benchmarks, and hidden costs to evaluate true ROI for your sales and RevOps stack.

Article summary
- There is no single market price for a B2B lead. Cience cites an average of $198 per lead across industries, from $31 in e-commerce to $370 in healthcare.
- Most offers fall into four structures: per-seat subscriptions, credit or pay-per-contact pools, tiered bundles with feature gates, and enterprise contracts.
- The invoice is one layer. Verification, enrichment, duplicate suppression, refresh, integration limits and internal handling change the real total cost.
- Compare vendors on total program cost divided by verified, ICP-matched, sales-accepted opportunities, not on cost per lead.
- Turn every proposal into the same worksheet: billing unit, usage rules, integration scope, contract exposure and outcome definitions.
Want to go further? Ask
 ChatGPT
 Claude
 Perplexity
 Grok
GrokOn this page
- 01What B2B Lead Generation Pricing Actually Buys You
- 02The Main Pricing Models and When Each One Wins
- 03Industry Benchmarks for Cost per Lead and Cost per MQL
- 04Hidden Costs That Change Your Real Total Cost
- 05Why Cost per Lead Is the Wrong Unit of Measurement
- 06Matching the Right Pricing Model to Your Buyer Persona
- 07How to Build a Pricing Evaluation Checklist
A B2B lead costs $198 on average across industries, with a range from $31 in e-commerce to $370 in healthcare, before the buyer accounts for verification, qualification, routing, and sales labor. CPL benchmark data from Cience, citing First Page Sage's 2024 figures, makes the commercial problem clear: there isn't one reliable market price for a lead. The relevant question is what the organization pays for a verified, ICP-matched, sales-accepted opportunity.
That shift changes how RevOps teams compare databases, paid acquisition, outsourced SDR programs, and enrichment platforms. A cheap record may create research work, bounce risk, duplicate cleanup, and poor AE follow-up. A more expensive verified contact can produce a lower cost per opportunity if it improves the probability that an SDR reaches the right person and that sales accepts the resulting meeting.
The quote said one price per lead.
The invoice, once verification, enrichment and CRM work show up:

What B2B Lead Generation Pricing Actually Buys You
A lead-generation contract rarely buys just “leads.” It usually combines four different deliverables, each with a different downstream cost.
Raw contact records provide names, companies, job titles, and contact details. The record becomes expensive when it lacks a current role, contains a duplicate, or falls outside the intended ICP. SDRs then spend time researching and correcting what the buyer assumed was finished data.
Enrichment attributes add firmographic, technographic, intent, hiring, location, and persona information. These fields support account prioritization and routing, but they also affect credit usage, refresh requirements, and CRM storage. A database that charges for a record and a separate enrichment layer is selling two different units, even if both appear on one invoice.
Deliverability infrastructure covers the operational ability to contact prospects. Depending on the provider, this may involve email verification, phone validation, sending capacity, reply handling, or other controls. If those services aren't included, the buyer absorbs the cost through separate tools, internal labor, or failed outreach.
Routing and integration move qualified records into the CRM, sales engagement platform, or assigned owner's queue. A CSV export has a different economic value from a governed workflow that suppresses duplicates, applies territory rules, and records the source of each contact. Integration scope explains why two vendors with similar contact counts can quote materially different totals.
The unit that matters to RevOps
The buyer should calculate:
Total program cost ÷ verified, ICP-matched, sales-accepted opportunities
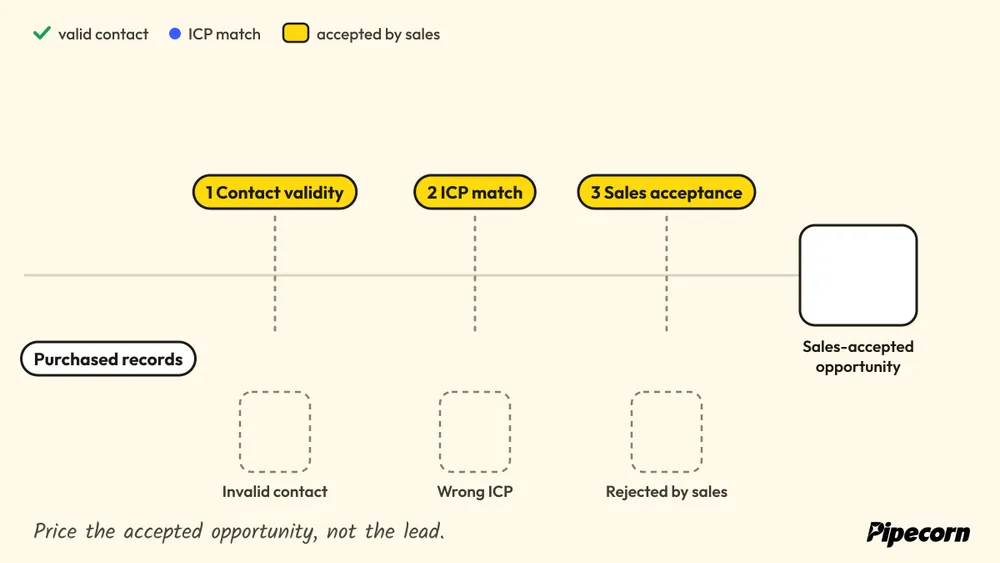
Total program cost includes the invoice, data and verification charges, internal management time, correction work, integration maintenance, and any required seats. The output is closer to the economic reality than cost per record or cost per export.
A lead-generation ROI calculator can help structure the comparison, but the calculation is only useful when the organization defines “accepted opportunity” before the campaign begins. The definition should include company fit, persona, geography, buying relevance, attendance, and the sales owner's acceptance decision.
Practical rule: Every quote should be translated into cost per usable pipeline unit before procurement compares vendors.
This lens also exposes why a low headline CPL can mislead. If a contact is stale or poorly matched, the record still consumes credits, SDR time, and outreach capacity. If the vendor supplies current data with clear replacement rules and reliable routing, the higher nominal price may reduce the amount of work required after delivery.
The Main Pricing Models and When Each One Wins
B2B lead generation pricing generally falls into four structures. The right choice depends less on the vendor label than on usage shape, operational ownership, and the downstream unit the buyer wants to optimize.
Per-seat subscriptions
Apollo and ZoomInfo represent the familiar per-seat or subscription structure. The billing unit is access to a platform, user seats, and an allocated level of functionality or data usage. This model wins when a team needs continuous prospecting and predictable access rather than occasional list purchases.
The risk is underutilization. A team may pay for seats that aren't used consistently, while still paying extra for enrichment, exports, phone data, or higher usage. Subscription access can also encourage teams to measure activity, such as searches or exports, rather than accepted opportunities.
Credit and pay-per-contact pools
Lusha, Cognism, and Snov.io are examples of credit-led or contact-oriented structures. This model suits a team running an experiment, entering a new market, or sourcing contacts in bursts. The buyer pays more closely in proportion to usage, which can be preferable when demand is irregular.
Credit pools become costly when credits expire, burn at different rates by data type, or produce records that require repeated lookup. A buyer should ask whether invalid contacts are refunded, whether duplicate records consume credits, and whether unused balances roll over.
Tiered bundles with feature gates
Tiered plans combine a recurring fee with limits on contacts, exports, integrations, automation, or user access. They offer a clear upgrade path, but the apparent simplicity can hide important thresholds. A team may select a lower tier and later discover that CRM sync, API access, advanced filters, or compliance controls sit behind a higher level.
The breakeven point depends on usage concentration. A small team with stable requirements can control costs well, while a fast-growing team may cross several limits in one planning cycle.
Enterprise and custom contracts
Enterprise agreements are designed around volume, routing, security, support, and negotiated service terms. They make sense for multinational teams, named-account programs, or organizations that need custom data processing and integration governance.
Custom contracts can reduce operational friction, but they often create longer commitments and more complicated exit conditions. Procurement should separate guaranteed capacity from optional usage, define replacement obligations, and specify how the provider credits duplicates or failed verification.
A practical explanation of qualification workflows can be found in this Captiwate lead tool guide. Qualification matters here because a contact database and a sales-ready lead aren't interchangeable commercial units.
| Model | Billing Unit | Best Fit | Main Risk |
|---|---|---|---|
| Per-seat subscription | User access and platform entitlement | Continuous prospecting by an active team | Paying for unused seats or gated usage |
| Credit or pay-per-contact | Credits, lookups, or delivered contacts | Bursty research and market testing | Credit waste, expiry, or poor record quality |
| Tiered bundle | Plan level plus usage or feature limits | Teams with predictable growth stages | Upgrade pressure when limits are crossed |
| Enterprise or custom | Negotiated capacity, routing, and support | Complex global or named-account motions | Longer commitments and opaque overages |
Flat subscriptions usually win on budgeting predictability. Credit pools usually win when demand is experimental or uneven. Neither structure is automatically cheaper. The decisive comparison is the effective cost of a sales-accepted opportunity after verification, routing, and internal handling. A broader discussion of service structures appears in B2B lead generation services, but the same normalization rule applies to every proposal.
Industry Benchmarks for Cost per Lead and Cost per MQL
A CPL benchmark measures acquisition output, while revenue teams pay for accepted opportunities. Those units diverge quickly. Content syndication, a paid-social form fill, an intent-qualified account, and an SDR-accepted meeting represent different workflow stages, even when vendors label each one a “lead.”
Benchmark figures are therefore reference bands, not universal purchasing targets. Cience's benchmark discussion puts the average B2B CPL at $198 across industries, citing First Page Sage (2024), with a range from $31 in e-commerce to $370 in healthcare.
Piperocket's compilation of Sopro's September 2025 benchmarks reported average CPLs of $25 for referrals, $73 for affiliate marketing, $142 for Facebook advertising, $206 for SEO, $225 for cold email, $267 for webinars, $408 for paid LinkedIn, $463 for PPC, and $840 for trade shows and events. The channel benchmark compilation should be read as channel context, since these figures do not establish a common standard for verification, qualification, or sales acceptance.
MQL benchmarks narrow the funnel definition, although they still depend on each company's scoring rules. Apollo's summary of a 2024 B2B Sales and Marketing Benchmark Report placed average cost per MQL at $240 for companies below $50,000 in annual contract value, $269 for companies between $50,000 and $100,000, and $186 above $100,000. Apollo's MQL pricing analysis links qualification economics to contract value, which makes a single market-wide MQL target unreliable.
| Channel | CPL Range | CPMQL Range | Definition Caveat |
|---|---|---|---|
| Content syndication | Not standardized in the available evidence | Not standardized | May represent a form fill rather than an ICP-matched contact |
| Paid social | Directional channel averages vary | Not standardized | Lead forms can contain weak intent or incomplete qualification |
| Intent data and ABM lists | Not standardized | Varies by intent and acceptance rules | Account-level signals do not identify a buying contact automatically |
| Outsourced SDR programs | Not standardized | Varies by meeting and SQL definition | Fees may include people, data, infrastructure, and management |
Procurement teams should convert every benchmark into cost per sales-accepted opportunity. That calculation adds verification, data decay, routing, rep handling, and rejected-record waste to the vendor fee. A $25 referral lead can cost more than a $225 cold-email lead if acceptance rates, rework, and handoff quality differ substantially.
Use this lead sourcing benchmark to compare definitions and acceptance rules before comparing headline prices. Geography, ICP scarcity, freshness, buying stage, and sales capacity can change total ownership cost without changing the advertised CPL.
Hidden Costs That Change Your Real Total Cost
The invoice is only one layer of acquisition cost. Validity's 2025 State of CRM Data Management report found that 76% of organizations said less than half of their CRM data was accurate and complete, while 37% reported losing revenue directly because of poor data quality. Coverage of the Validity survey supports a broader procurement conclusion: static data has an ownership cost after purchase.
The cost lines buyers often miss
Verification and enrichment can sit outside the quoted record price. Email and phone checks, waterfall lookups, firmographic fields, and intent overlays may each consume credits or trigger usage fees.
Duplicate suppression becomes a real cost when multiple databases feed the same CRM. Without a shared suppression process, sales teams can pay for the same account or contact more than once and create conflicting ownership records.
Refresh and job-change monitoring matter because a valid contact can become unusable after a role change. The buyer should ask how often records are refreshed, whether invalid contacts are replaced, and whether the provider tracks changes after delivery.
Integration and API limits affect engineering time. Rate limits, connector restrictions, and missing field mappings force RevOps teams to build workarounds or maintain manual imports.
Internal handling includes CSV preparation, bounce reconciliation, duplicate review, routing, SDR research, and AE feedback. These tasks don't appear on the vendor invoice, but they reduce selling capacity.
A centralized lead enrichment tools comparison can help RevOps teams inventory these components before comparing standalone database prices.
A line-by-line buying method
Instead of asking whether the provider's CPL is low, procurement should request an invoice model with separate rows for:
- Data access: Records, seats, exports, and search limits.
- Validation: Email checks, mobile checks, replacement rules, and failed lookup treatment.
- Enrichment: Firmographics, technology, intent, hiring, and job-change data.
- Operations: Onboarding, campaign setup, routing, CRM work, and support.
- Maintenance: Refresh frequency, duplicate suppression, monitoring, and correction.
- Internal burden: Estimated RevOps, SDR, and sales-management hours.
The contract should define the acceptance window for duplicates, invalid contacts, wrong titles, excluded accounts, and missing fields. It should also identify who owns the data, suppression lists, integration configuration, and exported assets when the agreement ends.
The important insight isn't that vendors hide costs deliberately. Different providers package different work into different units. The buyer's job is to expose those units and calculate the cost of producing a usable opportunity.
Why Cost per Lead Is the Wrong Unit of Measurement
CPL compresses quality into a single denominator. A scraped contact and a phone-verified, intent-qualified MQL can both appear as “one lead,” even though their probabilities of connection, qualification, and acceptance differ sharply.
The CPL report, looking at a scraped contact
and a phone-verified, intent-qualified MQL:

The unit fails for three reasons:
- It ignores deliverability. An invalid email or disconnected phone number creates no meaningful outreach opportunity.
- It ignores ICP fit. A current contact at the wrong company is still a poor acquisition unit.
- It ignores conversion probability. A lead with a low chance of becoming a sales-accepted opportunity can produce a higher downstream cost than a more expensive, better-qualified contact.
The better unit is cost per sales-accepted opportunity, or CPSAO. Some teams may use cost per qualified meeting booked, CPQMB, when meeting creation is the commercial objective. Both measures preserve a link between spend and the stage sales values.
Probability-weighted comparison
Consider two hypothetical acquisition paths. At a 2% MQL-to-opportunity conversion, a $50 CPL produces a $2,500 CPSAO. At a 10% conversion rate, a $200 CPL produces a $2,000 CPSAO. The higher nominal CPL wins because the opportunity conversion probability is stronger.
Those figures illustrate a model, not a benchmark or promised outcome. The calculation should be applied to the buyer's own cohort data, with separate rates for contact validity, ICP match, meeting attendance, sales acceptance, opportunity creation, and revenue.
The cheapest lead is often the one that consumes the least downstream capacity, not the one with the lowest acquisition price.
A documented lead qualification process should establish the stage definitions before the vendor is evaluated. Otherwise, providers can optimize for records delivered or meetings booked while sales leaders absorb the cost of rejection and rework.
Matching the Right Pricing Model to Your Buyer Persona
Buyer maturity and usage pattern determine whether a model reduces or increases total cost. A founder-led startup has different constraints from a RevOps team managing pooled SDR capacity, and an enterprise ABM program needs controls that a small outbound test won't use.
| Buyer Persona | Best-Fit Model | TCO Risk to Monitor |
|---|---|---|
| Founder-led startup with one SDR | Credit pool or starter tier | Paying for unused access while the founder handles cleanup |
| Mid-market RevOps team | Subscription with pooled seats and integration allowance | Seat expansion, enrichment overages, and poor routing governance |
| Enterprise ABM team | Custom contract with routing and service terms | Long commitments, opaque usage rules, and weak replacement clauses |
| Agency testing multiple client ICPs | Tiered or credit-based structure | Cross-client duplicate handling and uneven credit consumption |
Founder-led startup
A founder-led team usually needs flexibility more than maximum database breadth. Credit-based sourcing or a starter tier can protect cash while the team tests an ICP and learns which personas respond. The risk appears when the founder or lone SDR spends more time cleaning records than conducting outreach. A low invoice isn't efficient if internal selling capacity becomes the hidden subsidy.
Mid-market RevOps
A team supporting several SDRs benefits from shared governance, pooled usage, CRM integration, and predictable access. A subscription can win when the team prospecting pattern is steady and multiple users need the same workflow. RevOps should watch seat creep, API limits, enrichment burn, and whether the platform routes contacts correctly by territory and account owner.
Enterprise ABM
Named-account programs need stricter data handling. Custom routing, country-specific processing, dedicated support, service-level terms, and documented replacement rules may justify a higher contract value. The risk is paying for enterprise features without measuring whether the target-account cohort creates accepted opportunities. Procurement should require account-level reporting, suppression controls, and an exit path for underused capacity.
Agencies and multi-client operators
Agencies need a model that tolerates uneven demand across clients. Tiered access or credits can be useful when one account requires heavy research and another needs only a small test. The agency should isolate each client's records, suppression rules, and usage attribution. Otherwise, one difficult ICP can distort the blended economics and make a profitable client appear less efficient than it is.
The model wins when it lowers CPSAO, not when it produces the smallest monthly invoice. A higher subscription can be economically superior if it removes repeated verification, routing, and manual reconciliation.
How to Build a Pricing Evaluation Checklist
Procurement should turn every proposal into the same worksheet. The purpose isn't to force every provider into one commercial model. It is to make different models comparable at the stage where sales and finance care about the result.
Normalize the quote
Record the following before approval:
- Billing unit: Seat, credit, record, meeting, accepted meeting, SQL, project, or recurring capacity.
- Usage rules: Credit burn, rollover, expiry, duplicate treatment, invalid-contact replacement, and overage thresholds.
- People and access: Seats, assigned users, support roles, account coverage, and internal responsibilities.
- Integration scope: CRM, sales engagement tools, API access, routing, field mapping, dashboards, and export rights.
- Operational fees: Onboarding, professional services, setup, refresh, verification, enrichment, and infrastructure.
- Contract exposure: Minimum term, notice period, auto-renewal, pause rights, unused credits, termination fees, and repricing conditions.
- Outcome definitions: Accepted meeting, SQL, opportunity, attribution window, rejection rules, and dispute process.
A second-source comparison is essential. A provider directory such as lead generation companies from MarTech Do can help create a shortlist, but the shortlist isn't the analysis. Each candidate still needs to disclose the same cost and acceptance fields.
Score the commercial risk
A useful scorecard separates price certainty, data validity, ICP match, routing quality, internal labor, and sales acceptance. The team should calculate effective cost per accepted opportunity for every active vendor, not only for new proposals.
The review should also include a repricing clause after 90 days of usage data. That review can replace assumptions with observed validity, acceptance, opportunity, and rework rates. If a vendor's nominal CPL looks attractive but its accepted-opportunity cost remains high, the contract needs a scope change, a credit adjustment, or an exit.
The procurement decision is complete only when the invoice, internal labor, and downstream conversion are visible in one model.
Within the current quarter, RevOps leaders should run every active provider through this checklist, identify the bottom quartile by spend-weighted value, and redirect the recoverable budget toward the model whose unit economics survive the audit.
Pipecorn aggregates data providers to source verified email and mobile contacts, applies validation and cleaning, and supports delivery into CRM and sales engagement workflows. For teams evaluating B2B lead generation pricing, visit Pipecorn to compare a credit-based sourcing workflow against the verification, routing, and internal labor costs in the current stack.